
Bar Graph Representation of Data
Bar Graph Representation of Data: Overview
This topic covers concepts, such as, Bar Graphs, Interpretation of Bar Graphs, Structure of Bar Graphs and Horizontal Bar Graphs etc.
Important Questions on Bar Graph Representation of Data
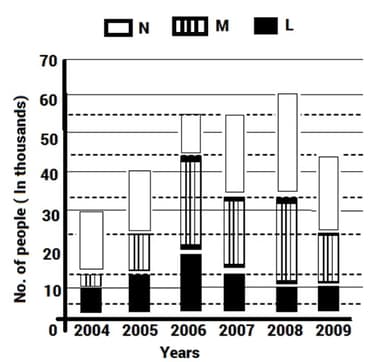
Study the given graph carefully to answer the questions that follow-
Number of people (In thousands) using three different types of mobile services over the years
Read the following information and answer the given question.
Following graph provides data about total
milk production((in million litres) ) in different sectors 
If the milk production in India from the year 2000-2001 to the year 2001-2002 increased at the rate of 5% in Individual sector, 5% in Cooperative sector and 10% in Government sector, then what is the difference in total milk production between 1999-2000 and 2001-2002 for the three sectors?
Following bar-graph shows the percentage growth of population of six cities during and .

If population of City in is , what is its population in
Read the following information and answer the given question.
Following graph provides data about total
milk production((in million litres) ) in different sectors 
In the year 1999-2000, it was found that the milk produced per employee in the Government, Cooperative and Individual sectors was 1500 litres, 3000 litres and 5600 litres, respectively. How many people (approx.) were employed in the milk industry during that year?
Study the following graph carefully and answer the questions that follow.
The following graph gives the profit percentage of three companies in different years.
Profit = Income expenditure
Profit % = [ {Income expenditure} / expenditure]
If company A and C has equal profit in , then Income earned by company C is (approx) what percent of the expenditures incurred by company A?
Study the bar chart of All India Monsoon Rainfall given below to answer the question.
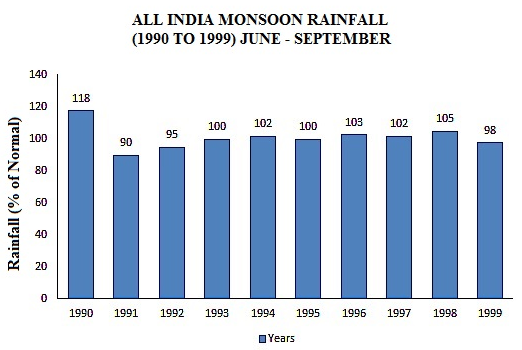
Out of the Years, how many years have above-normal rainfall?
The following bar graph depicts the annual rates of inflation in percentages for and .
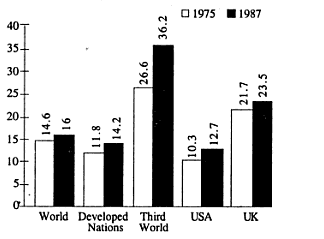
In the year , the inflation rate in the third world countries vis-a-vis the whole world jumped approximately by:
The bar graph provided below gives the data of the production of paper (in lakh tonnes) by three different companies X, Y and Z over the years. Study the graph and answer the questions that follow.
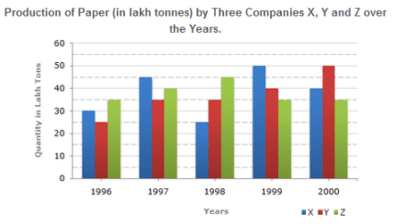
The average production for five years was maximum for which Company?
Study the following graph carefully to answer these questions
The graph shows the Percent Profit earned by two companies over different months.

If the amount of profit earned by company P in May was Rs. 5 lakhs, what was its total investment in that month?
Following bar-graph shows the percentage growth of population of six cities during and .
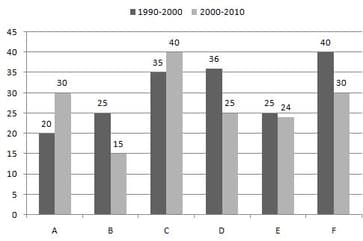
Population of City and City in is in ratio of and population of City in is so what is the population of City in
Study the following graph carefully to answer these questions
The graph shows the Percent Profit earned by two companies over different months.
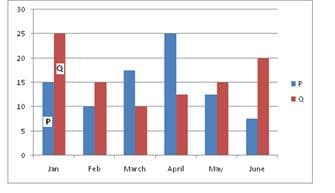
If the amount of profit earned by company P in May was ₹ 5 lakhs, what was its total investment in that
month?
Study the following graph carefully and answer the questions given below it:
Production of six types of car produced by a manufacture for year & (in )
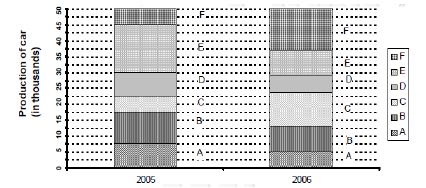
The total production of which of the following types of cars in was exactly equal to the production of E type cars in?
Read the following information and answer the given question.
The following graph provides data about total
milk production(in ) in different sectors
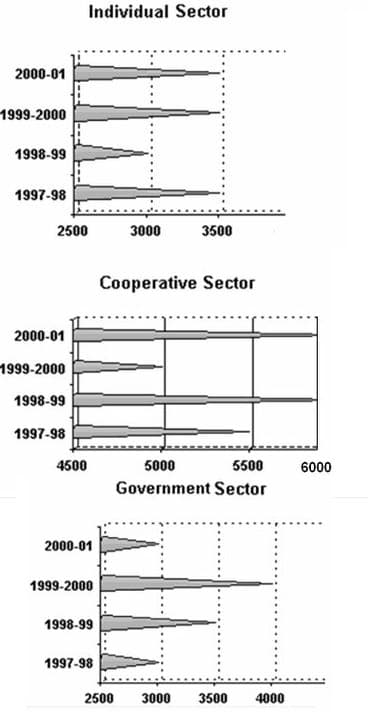
What is the approximate growth in milk production in India from to ?
Study the following graph carefully and answer the questions given below it:
Production of six types of car produced by a manufacture for year & (in)
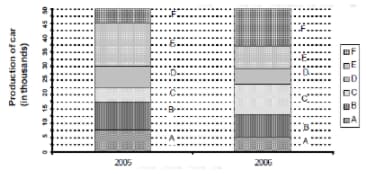
For which type of car was there a highest percent decrease in production from to ?
Study the following graph carefully to answer these questions
The graph shows the Percent Profit earned by two companies over different months.

If the amount invested by the two companies in February was equal, what was the respective ratio of the total income of the company P to that of Q in that month?
Refer to the graph below to answer these questions:
QUARTERLY PROFITS DEPARTMENTAL STORE:

During the period , how many quarters exceeded the profit of ?
Study the following graph carefully to answer the question.
The graph shows the Percent Profit earned by two companies over different months.
What is the profit earned by Company Q in June if their investment for the month was
Study the following graph carefully to answer these questions
The graph shows the Percent Profit earned by two companies over different months.

If each of the companies P and Q invested Lakhs in June, what was the average profit earned by the two companies in that month?
The following bar graph depicts the annual rates of inflation in percentages for and .

Comparing the figures for the USA vis-a-vis the developed nations, it can be concluded that:
Study the following graph carefully to answer these questions
The graph shows the Percent Profit earned by two companies over different months.
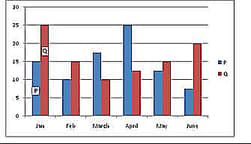
If the profit earned by company Q in January was Rs. 16.4 Lakhs, What was the total income of the company in that month?


